Electrify Chicago
An independent tool for viewing City of Chicago building data
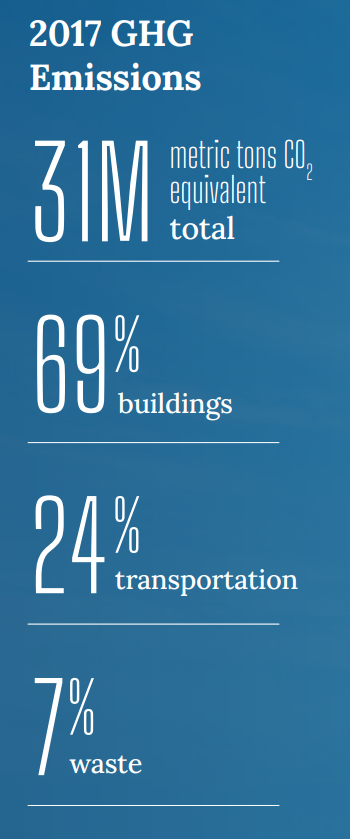
According to the
2022 Chicago Climate Action Plan ,
a whopping 69% of Chicago's emissions come from buildings, making it
our biggest challenge and our biggest opportunity as a city to tackle
change. At Electrify Chicago, we want to showcase some of the best and worst performing
buildings in the city using publicly available data and manual annotations to add
building photographs and label multi-building owners like universities.
,
a whopping 69% of Chicago's emissions come from buildings, making it
our biggest challenge and our biggest opportunity as a city to tackle
change. At Electrify Chicago, we want to showcase some of the best and worst performing
buildings in the city using publicly available data and manual annotations to add
building photographs and label multi-building owners like universities.
You can start by looking at Chicago's buildings with the highest greenhouse gas intensity - this means that they use the most energy when adjusted per unit of square foot, so big buildings could actually perform much better than very inefficient small buildings on this metric.
New Article
📰 $30 Million In Missed Fines
The City Of Chicago failed to collect $30 million in potential fines from the building benchmarking ordinance, reducing transparency and accountability.
Legislative update! 🎉
As of late January 2024, legislation is being introduced to require new use more efficient forms of water and space heating, via the Clean And Affordable Buildings Ordinance (CABO), which will reduce the number of highly polluting and inefficient buildings that end up on this site.
If you're in Chicago,
write to your alderman to support the CABO!
Chicago Buildings by Greenhouse Gas Intensity
Note: Data only includes large Chicago buildings from 2021, unless explicitly stated otherwise.
Note: This data only includes buildings whose emissions are reported
under the
Chicago Energy Benchmarking Ordinance. According to the City “As of 2016,
this list includes all commercial, institutional, and residential buildings larger than
50,000 square feet.” This dataset is also then filtered to only buildings with
reported emissions > 1,000 metric tons CO2 equivalent.
This data is also from 2021, but when new benchmark data is available, we'll update the site.
| Property Name / address | Primary Property Type |
Greenhouse Gas Intensity (kg CO2 eq./sqft) |
Total Greenhouse Emissions (metric tons CO2 eq.) |
|---|---|---|---|
|
121 West Wacker Drive
🚩
221 N LaSalle St
| Office | 11.7 kg/sqft
Highest 11%
| 6,070 tons
Highest 5%
|
|
Grace Shores
639 W GRACE ST
| Multifamily Housing | 11.7 kg/sqft
Highest 11%
| 620 tons
Lowest 36%
|
|
Old Town Park - Phase 2
202 W Hill Street
| Multifamily Housing | 11.6 kg/sqft
Highest 11%
| 3,318 tons
Highest 12%
|
|
Villa at Windsor Park
2649 E 75th St
| Senior Living Community | 11.6 kg/sqft
Highest 11%
| 1,137 tons
Highest 40%
|
|
Lake Meadows 2
533 E 33RD PL
| Multifamily Housing | 11.6 kg/sqft
Highest 11%
| 1,248 tons
Highest 37%
|
|
Palmolive Building Condominium Association
913 - 921 N Michigan Ave
| Multifamily Housing | 11.6 kg/sqft
Highest 11%
| 4,601 tons
Highest 8%
|
|
Lake Meadows 1
555 E 33RD PL
| Multifamily Housing | 11.5 kg/sqft
Highest 11%
| 1,241 tons
Highest 38%
|
|
Central Plaza Residential Home
321 N CENTRAL AVE
| Residential Care Facility | 11.5 kg/sqft
Highest 11%
| 809 tons
Lowest 47%
|
|
Lurie Children's Faculty Office Building
155 E Superior St
| Office | 11.5 kg/sqft
Highest 11%
| 949 tons
Highest 47%
|
|
Charles Allen Prosser Career Academy High School
(CPS)
2148 N Long Ave
| K-12 School | 11.4 kg/sqft
Highest 11%
| 2,390 tons
Highest 18%
|
|
Centennial Hall
(DePaul)
2345 N Sheffield Ave
| College/University | 11.4 kg/sqft
Highest 11%
| 1,014 tons
Highest 44%
|
|
Goodman Theatre
56 60 W Randolph St
| Office | 11.4 kg/sqft
Highest 11%
| 580 tons
Lowest 33%
|
|
06620-Chicago, IL
700 N Michigan Ave
| Retail Store | 11.4 kg/sqft
Highest 11%
| 2,020 tons
Highest 22%
|
|
BAI Century, LLC
2828 N Clark St
| Enclosed Mall | 11.4 kg/sqft
Highest 11%
| 1,991 tons
Highest 23%
|
|
Point at Clark
3131 N Clark St
| Strip Mall | 11.4 kg/sqft
Highest 11%
| 1,086 tons
Highest 42%
|
Data Source:
Chicago Energy Benchmarking Data