Electrify Chicago
An independent tool for viewing City of Chicago building data
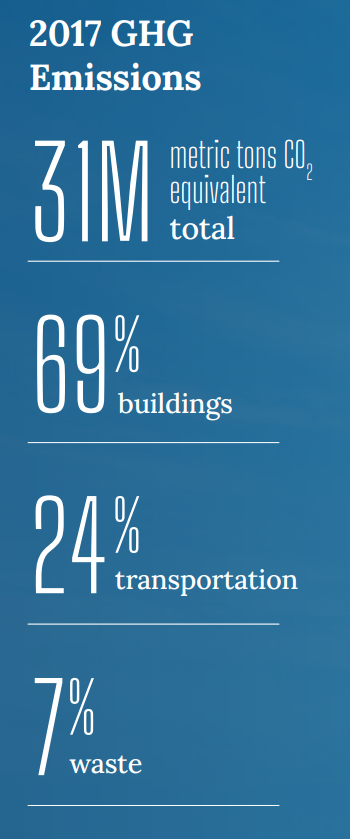
According to the
2022 Chicago Climate Action Plan ,
a whopping 69% of Chicago's emissions come from buildings, making it
our biggest challenge and our biggest opportunity as a city to tackle
change. At Electrify Chicago, we want to showcase some of the best and worst performing
buildings in the city using publicly available data and manual annotations to add
building photographs and label multi-building owners like universities.
,
a whopping 69% of Chicago's emissions come from buildings, making it
our biggest challenge and our biggest opportunity as a city to tackle
change. At Electrify Chicago, we want to showcase some of the best and worst performing
buildings in the city using publicly available data and manual annotations to add
building photographs and label multi-building owners like universities.
You can start by looking at Chicago's buildings with the highest greenhouse gas intensity - this means that they use the most energy when adjusted per unit of square foot, so big buildings could actually perform much better than very inefficient small buildings on this metric.
New Article
📰 $30 Million In Missed Fines
The City Of Chicago failed to collect $30 million in potential fines from the building benchmarking ordinance, reducing transparency and accountability.
Legislative update! 🎉
As of late January 2024, legislation is being introduced to require new use more efficient forms of water and space heating, via the Clean And Affordable Buildings Ordinance (CABO), which will reduce the number of highly polluting and inefficient buildings that end up on this site.
If you're in Chicago,
write to your alderman to support the CABO!
Chicago Buildings by Greenhouse Gas Intensity
Note: Data only includes large Chicago buildings from 2021, unless explicitly stated otherwise.
Note: This data only includes buildings whose emissions are reported
under the
Chicago Energy Benchmarking Ordinance. According to the City “As of 2016,
this list includes all commercial, institutional, and residential buildings larger than
50,000 square feet.” This dataset is also then filtered to only buildings with
reported emissions > 1,000 metric tons CO2 equivalent.
This data is also from 2021, but when new benchmark data is available, we'll update the site.
| Property Name / address | Primary Property Type |
Greenhouse Gas Intensity (kg CO2 eq./sqft) |
Total Greenhouse Emissions (metric tons CO2 eq.) |
|---|---|---|---|
|
Goldblatts Building
🏆
1609 W Chicago Ave
| Office | 1.6 kg/sqft
#18 Lowest in Chicago*
| 263 tons
Lowest 6%
|
|
Stratford at South Commons Condo
🏆
2605 S Indiana Ave
| Multifamily Housing | 1.6 kg/sqft
#18 Lowest in Chicago*
| 1,319 tons
Highest 35%
|
|
Six Corners Plaza
🏆
3970 - 3982 N Milwaukee Ave
| Strip Mall | 1.6 kg/sqft
#18 Lowest in Chicago*
| 129 tons
#17 Lowest in Chicago*
|
|
309-The Breakers at Edgewater Beach
🏆
5333 N Sheridan Rd
| Senior Living Community | 1.5 kg/sqft
#16 Lowest in Chicago*
| 2,537 tons
Highest 17%
|
|
860 West Evergreen
🏆
860 W Evergreen Ave
| Office | 1.4 kg/sqft
#14 Lowest in Chicago*
| 151 tons
#24 Lowest in Chicago*
|
|
1033 Van Buren
🏆
1033 W VAN BUREN ST
| Office | 1.4 kg/sqft
#14 Lowest in Chicago*
| 119 tons
#14 Lowest in Chicago*
|
|
MAYNARD AT ELAINE PLACE - CLK
🏆
3426 N Elaine Place
| Multifamily Housing | 1.2 kg/sqft
#13 Lowest in Chicago*
| 368 tons
Lowest 15%
|
|
2130-2140 W Fulton
🏆
2130 2140 W Fulton St
| Office | 1.1 kg/sqft
#12 Lowest in Chicago*
| 57 tons
#8 Lowest in Chicago*
|
|
Marketplace At Six Corners
🏆
4612 - 4730 W Irving Park Rd
| Other - Mall | 1.0 kg/sqft
#11 Lowest in Chicago*
| 80 tons
#10 Lowest in Chicago*
|
|
Devon Executive
🏆
4001 W Devon Ave
| Office | 0.9 kg/sqft
#9 Lowest in Chicago*
| 47 tons
#4 Lowest in Chicago*
|
|
ACE Technical Charter High School
🏆
(CPS)
5400 S State St
| K-12 School | 0.9 kg/sqft
#9 Lowest in Chicago*
| 59 tons
#9 Lowest in Chicago*
|
|
6160 N Cicero
🏆
6160 N CICERO AVE
| Office | 0.8 kg/sqft
#7 Lowest in Chicago*
| 51 tons
#5 Lowest in Chicago*
|
|
Bucktown Park Condominium Association
🏆
1830 N WINCHESTER AVE
| Multifamily Housing | 0.8 kg/sqft
#7 Lowest in Chicago*
| 54 tons
#7 Lowest in Chicago*
|
|
Cambria Hotel
🏆
32 W RANDOLPH ST
| Hotel | 0.7 kg/sqft
#6 Lowest in Chicago*
| 166 tons
Lowest 1%
|
|
U.S. Cellular Plaza - 8420 _ Goby LLC
🏆
8420 W Bryn Mawr Ave
| Office | 0.5 kg/sqft
#4 Lowest in Chicago*
| 114 tons
#12 Lowest in Chicago*
|
Data Source:
Chicago Energy Benchmarking Data