Electrify Chicago
An independent tool for viewing City of Chicago building data
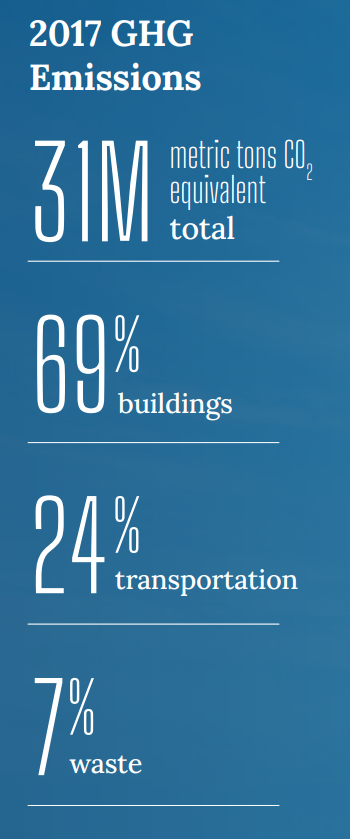
According to the
2022 Chicago Climate Action Plan ,
a whopping 69% of Chicago's emissions come from buildings, making it
our biggest challenge and our biggest opportunity as a city to tackle
change. At Electrify Chicago, we want to showcase some of the best and worst performing
buildings in the city using publicly available data and manual annotations to add
building photographs and label multi-building owners like universities.
,
a whopping 69% of Chicago's emissions come from buildings, making it
our biggest challenge and our biggest opportunity as a city to tackle
change. At Electrify Chicago, we want to showcase some of the best and worst performing
buildings in the city using publicly available data and manual annotations to add
building photographs and label multi-building owners like universities.
You can start by looking at Chicago's buildings with the highest greenhouse gas intensity - this means that they use the most energy when adjusted per unit of square foot, so big buildings could actually perform much better than very inefficient small buildings on this metric.
New Article
📰 $30 Million In Missed Fines
The City Of Chicago failed to collect $30 million in potential fines from the building benchmarking ordinance, reducing transparency and accountability.
Legislative update! 🎉
As of late January 2024, legislation is being introduced to require new use more efficient forms of water and space heating, via the Clean And Affordable Buildings Ordinance (CABO), which will reduce the number of highly polluting and inefficient buildings that end up on this site.
If you're in Chicago,
write to your alderman to support the CABO!
Chicago Buildings by Greenhouse Gas Intensity
Note: Data only includes large Chicago buildings from 2021, unless explicitly stated otherwise.
Note: This data only includes buildings whose emissions are reported
under the
Chicago Energy Benchmarking Ordinance. According to the City “As of 2016,
this list includes all commercial, institutional, and residential buildings larger than
50,000 square feet.” This dataset is also then filtered to only buildings with
reported emissions > 1,000 metric tons CO2 equivalent.
This data is also from 2021, but when new benchmark data is available, we'll update the site.
| Property Name / address | Primary Property Type |
Greenhouse Gas Intensity (kg CO2 eq./sqft) |
Total Greenhouse Emissions (metric tons CO2 eq.) |
|---|---|---|---|
|
THE CAROLAN APARTMENTS
5480 S CORNELL AVE
| Multifamily Housing | 5.1 kg/sqft
Lowest 25%
| 617 tons
Lowest 36%
|
|
Kass Management Services, Inc.(5620-5626 N. Kenmore Ave.)
5620 5626 N KENMORE AVE
| Multifamily Housing | 5.1 kg/sqft
Lowest 25%
| 278 tons
Lowest 7%
|
|
468 West Melrose Street
468 W MELROSE ST
| Multifamily Housing | 5.1 kg/sqft
Lowest 25%
| 282 tons
Lowest 8%
|
|
900 W Fullerton
900 W FULLERTON AVE
| Multifamily Housing | 5.1 kg/sqft
Lowest 25%
| 270 tons
Lowest 7%
|
|
One North LaSalle
1 N LaSalle St
| Office | 5.1 kg/sqft
Lowest 25%
| 2,803 tons
Highest 14%
|
|
Lake View High School
(CPS)
4015 N Ashland Ave
| K-12 School | 5.1 kg/sqft
Lowest 25%
| 1,353 tons
Highest 35%
|
|
Pratt Blvd Place Condo Assoc
1645 1663 W PRATT BLVD
| Multifamily Housing | 5.1 kg/sqft
Lowest 25%
| 349 tons
Lowest 13%
|
|
25 E Washington
25 E Washington St
| Office | 5.1 kg/sqft
Lowest 25%
| 2,490 tons
Highest 17%
|
|
Gurdon S Hubbard High School
(CPS)
6200 S Hamlin Ave
| K-12 School | 5.1 kg/sqft
Lowest 25%
| 1,108 tons
Highest 41%
|
|
Michael M Byrne Elementary School
5329 S Oak Park Avenue
| K-12 School | 5.0 kg/sqft
Lowest 23%
| 394 tons
Lowest 17%
|
|
One Bennett Park
451 E Grand Ave
| Multifamily Housing | 5.0 kg/sqft
Lowest 23%
| 3,960 tons
Highest 9%
|
|
3Eleven
311 W Illinois St
| Multifamily Housing | 5.0 kg/sqft
Lowest 23%
| 1,448 tons
Highest 32%
|
|
Marlowe - LMC
675 N Wells St
| Multifamily Housing | 5.0 kg/sqft
Lowest 23%
| 649 tons
Lowest 38%
|
|
Monroe Aberdeen Place (mn147)
33 S Aberdeen St
| Multifamily Housing | 5.0 kg/sqft
Lowest 23%
| 947 tons
Highest 47%
|
|
Wells Place Apartments
839 S WELLS ST
| Multifamily Housing | 5.0 kg/sqft
Lowest 23%
| 529 tons
Lowest 29%
|
Data Source:
Chicago Energy Benchmarking Data